With PostFlow Analytics, you gain a complete overview of your social media impact, from group level summaries to platform specific data and detailed post performance metrics. View your social media performance from multiple perspectives.
You’ll get a high-level overview of performance across all connected profiles, with the flexibility to drill down into individual social platforms and also individual accounts. Discover trends, identify top performing content, and make smarter, data driven decisions.
PostFlow tracks post metrics for 30 days after publishing and then stores historical data for years. This allows you to track progress over time and compare results month-over-month or year-over-year even long after the original content was published.
There are 3 main sections in PostFlow analytics:
- Group overview
- Profiles
- Content
Analytics overview for active group
Get a quick and complete overview of your entire group's performance over the past 30 days on one page. Data includes every connected account within the selected group.
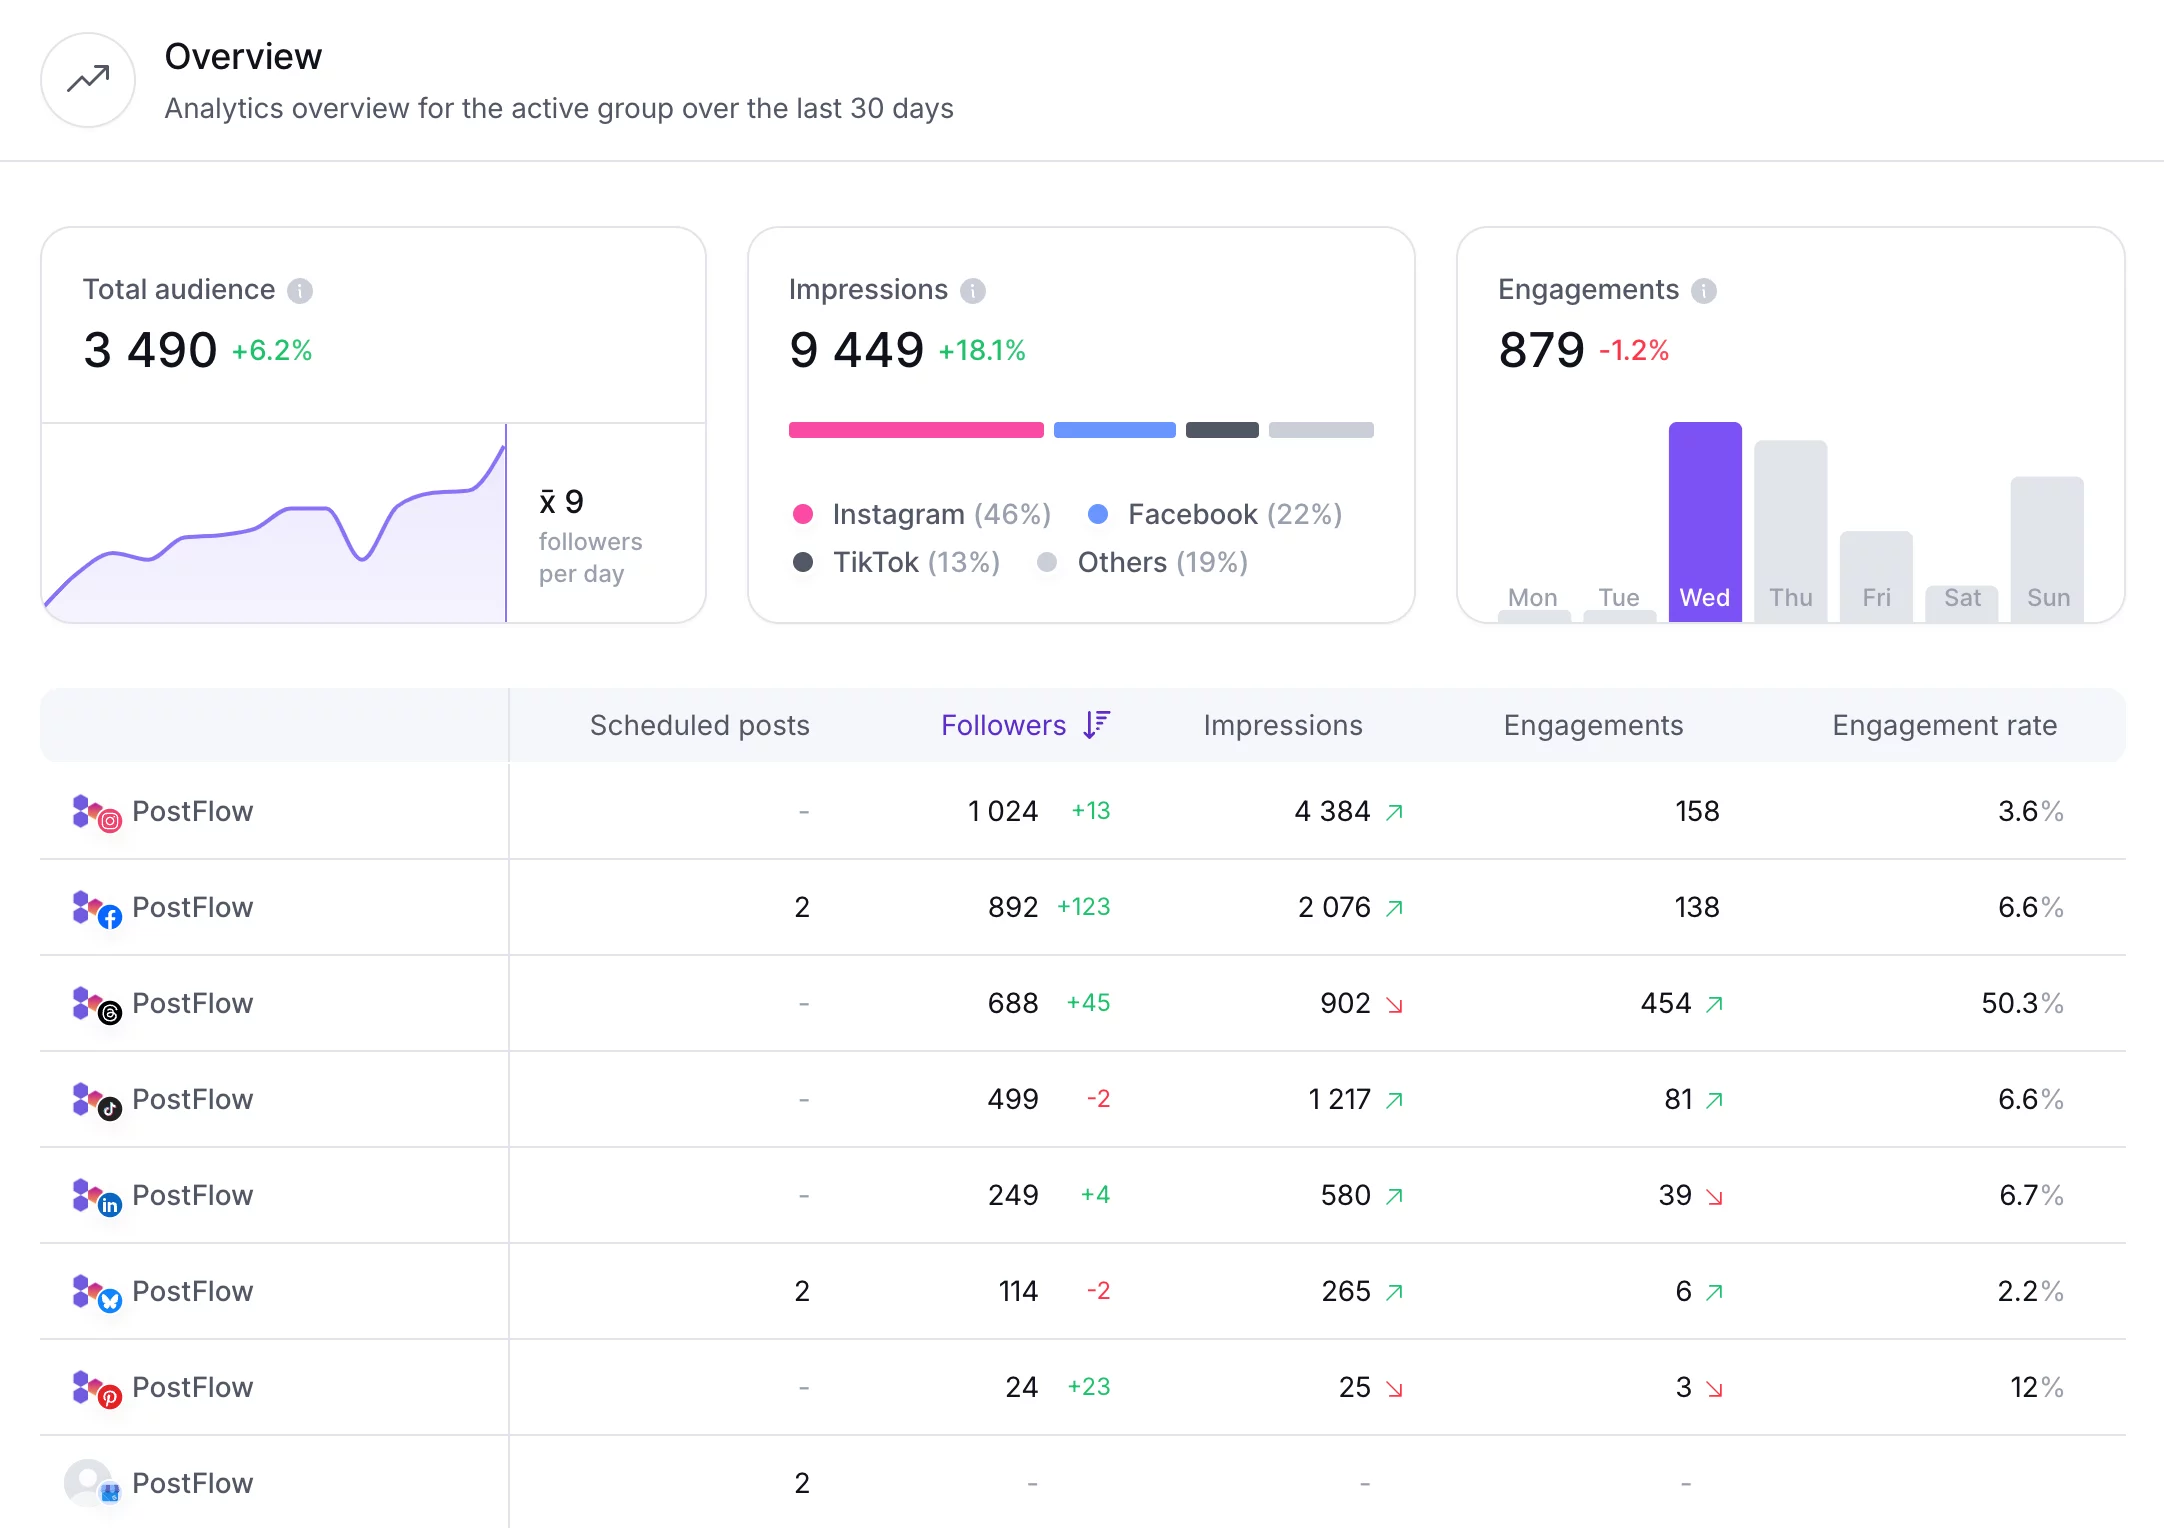
You can find here key metrics like total audience size and its growth over time, total impressions, and how they are distributed across networks. Discover which days your audience is most active and when they engage most with your content.
Filters
The filters are persistent across the entire analysis section. So you can easily start with data analysis at the profile level and then gradually move on to content analysis to individual posts published in a given range.
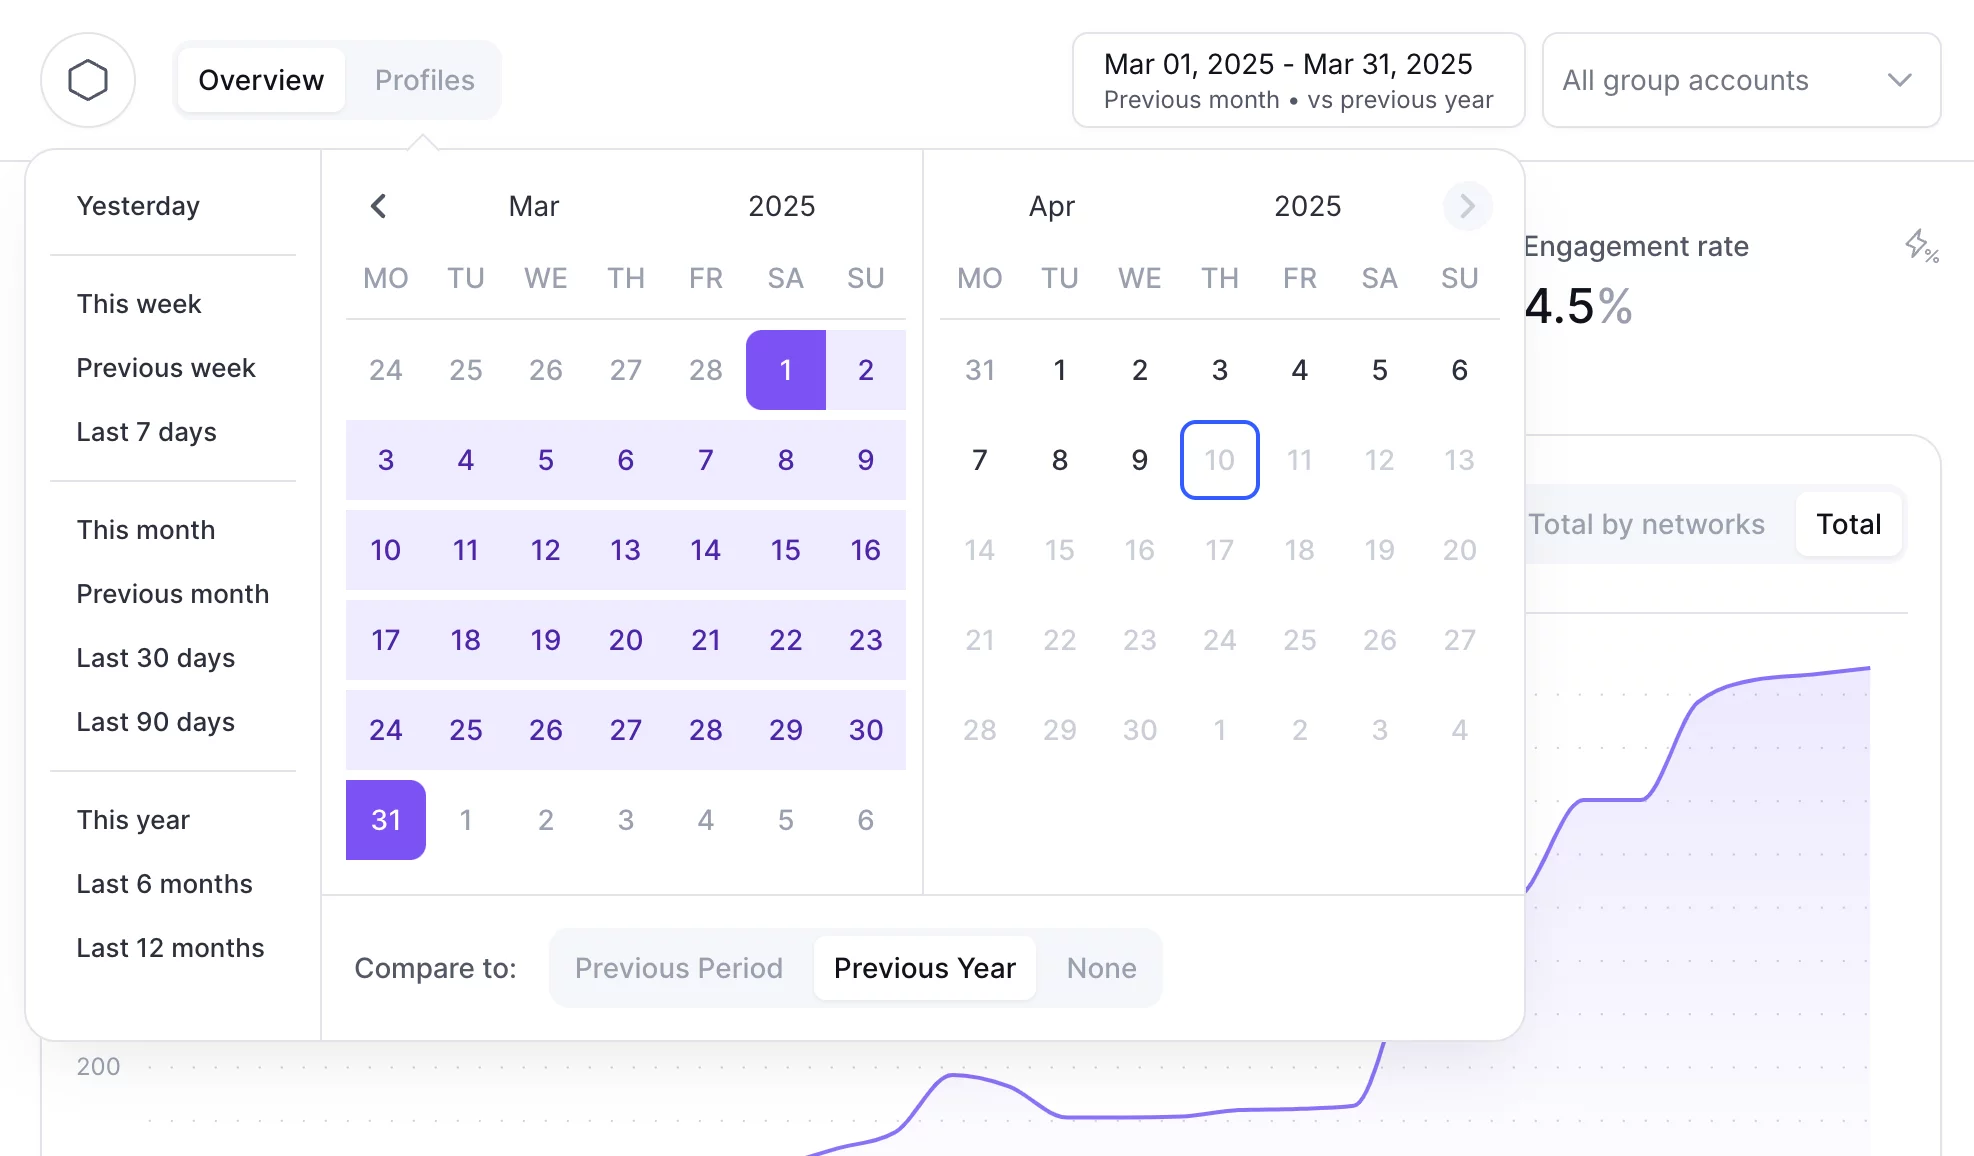
Use filters to customize how data is displayed and compared:
- Select date range
- Choose a comparison method (previous period vs. same time last year)
- Filter by specific social networks or individual social accounts
Filter social accounts
You can select multiple social accounts or click "Only" next to a profile to view analytics for that account alone.
Profiles Analytics
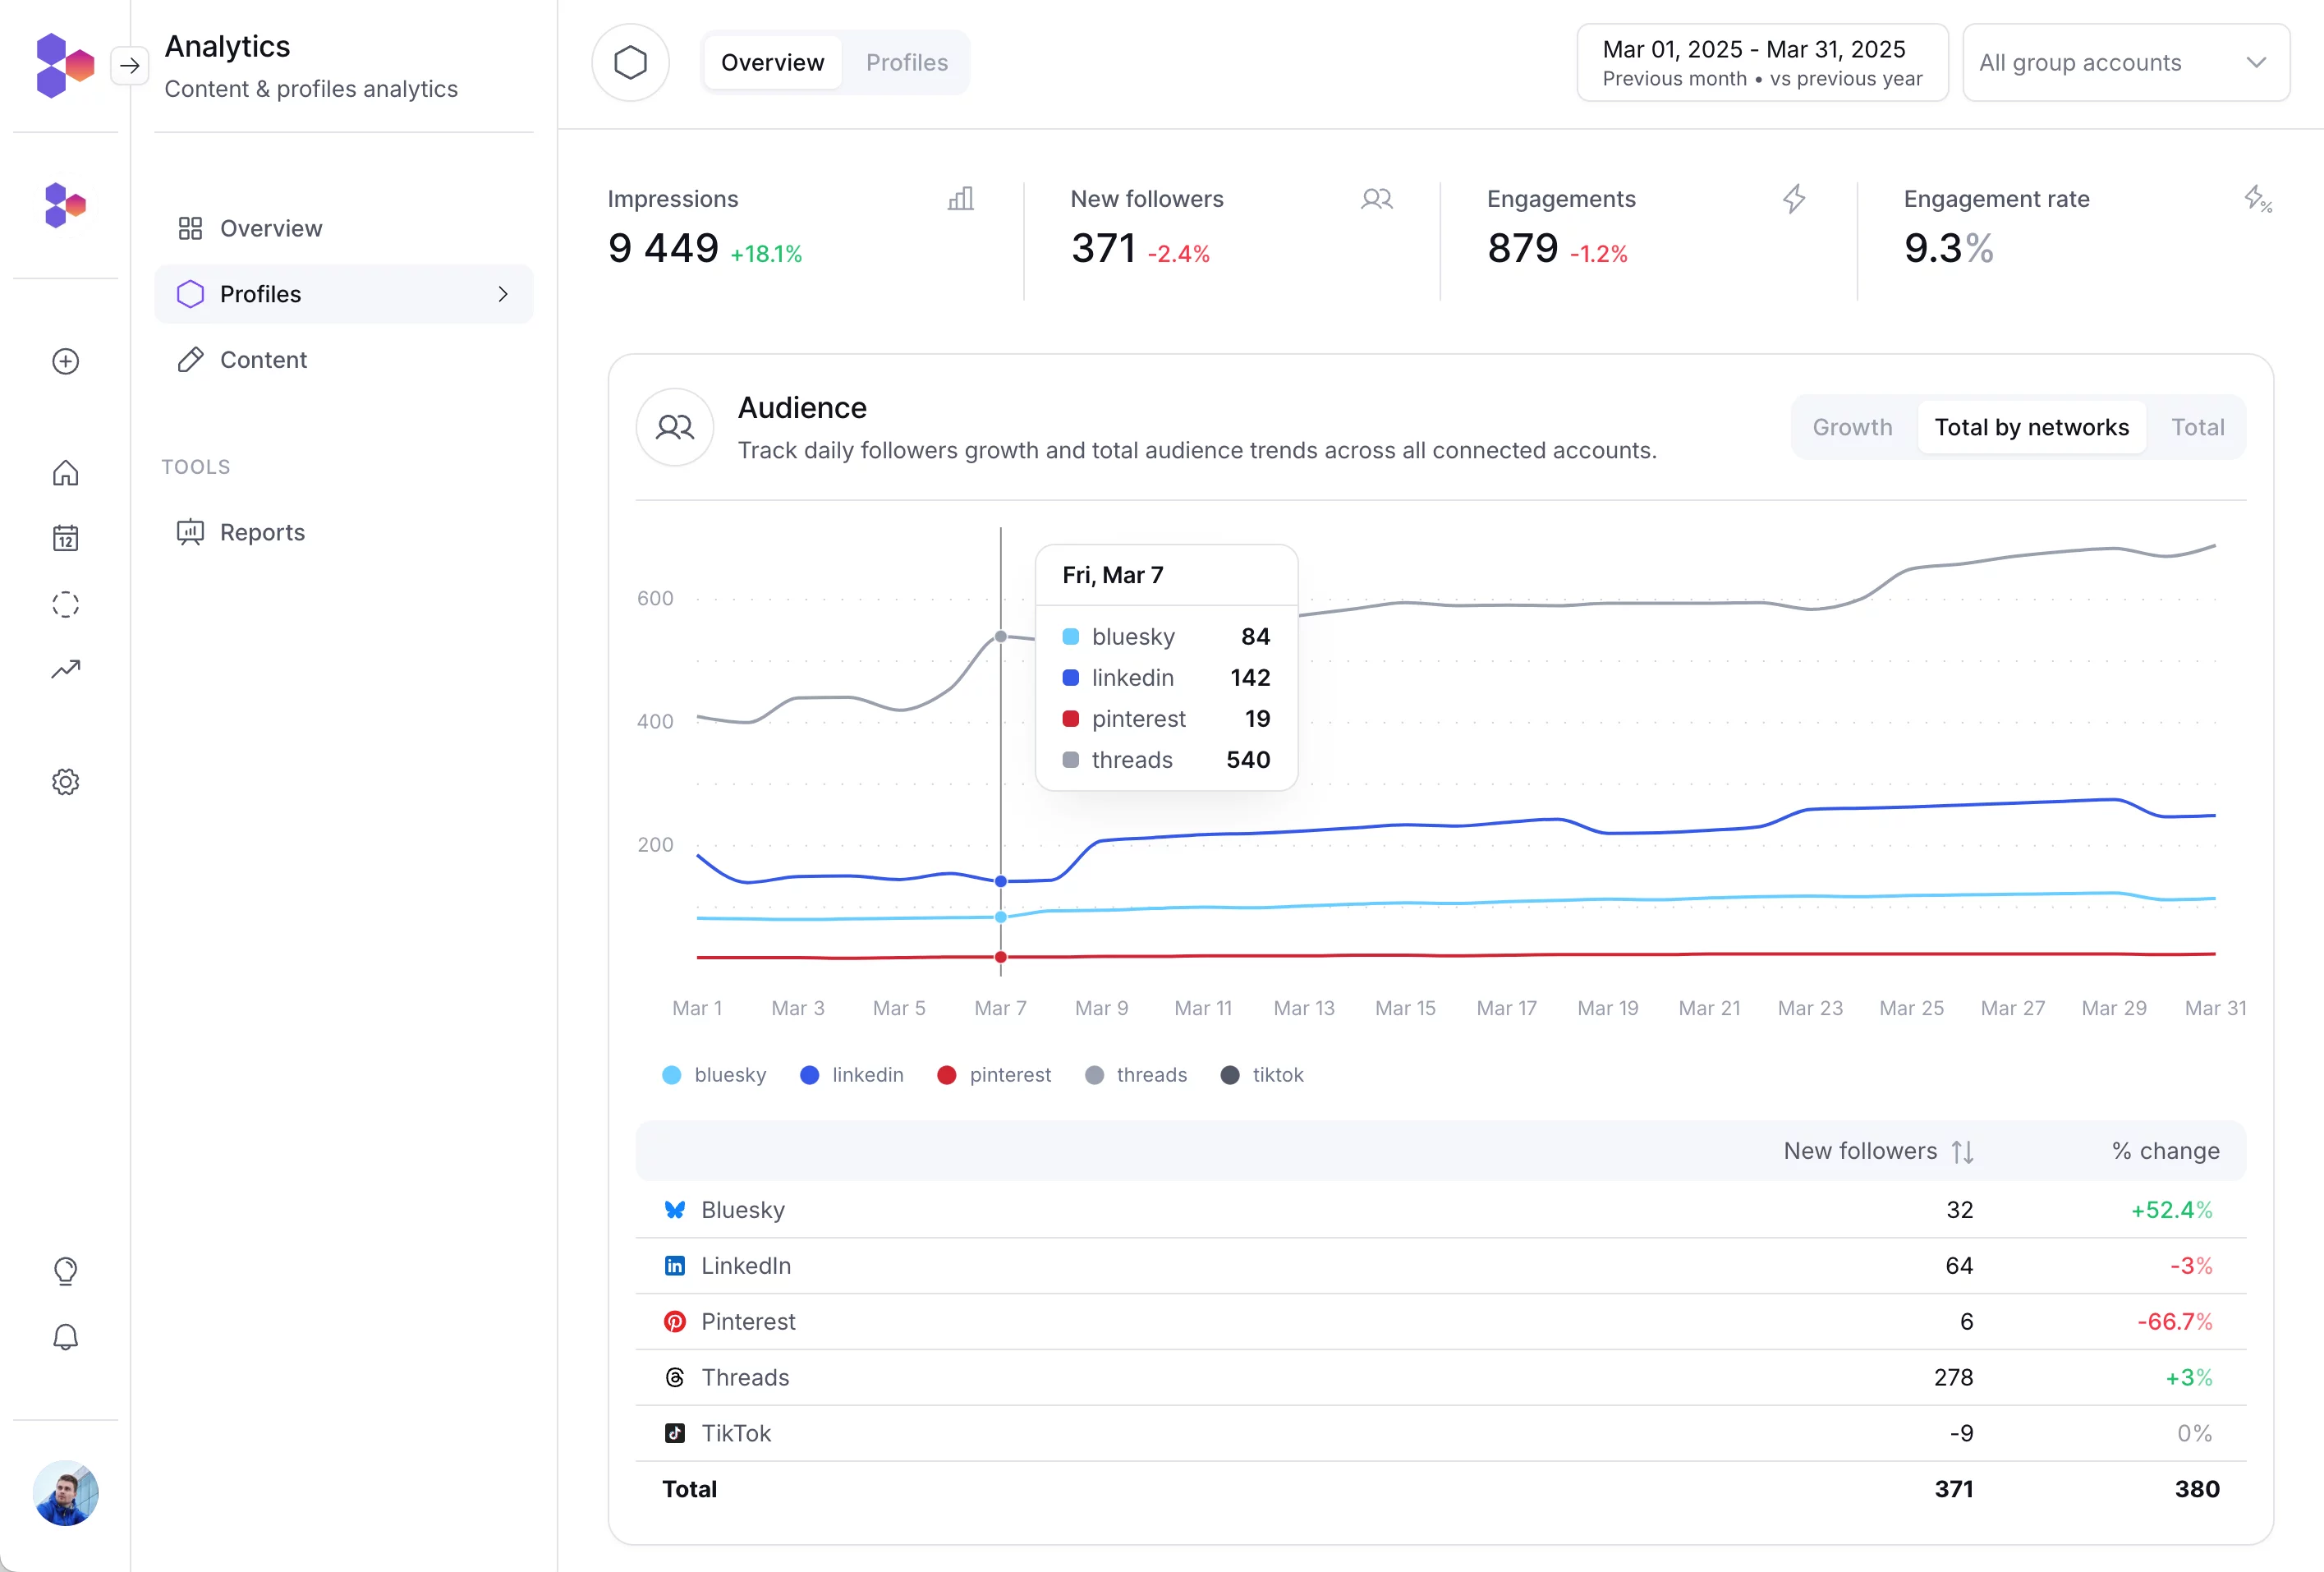
Get a high-level overview of your connected social accounts and how they grow over time. You can toggle between viewing data for your entire group, a specific network or individual social account.
The data on the profiles analytics page are aggregated metrics accrued during the selected date range. Metrics are updated daily at midnight in the UTC time zone.
Audience growth
Track daily audience gains for individual platforms or accounts, and view the total audience growth trend across all networks.
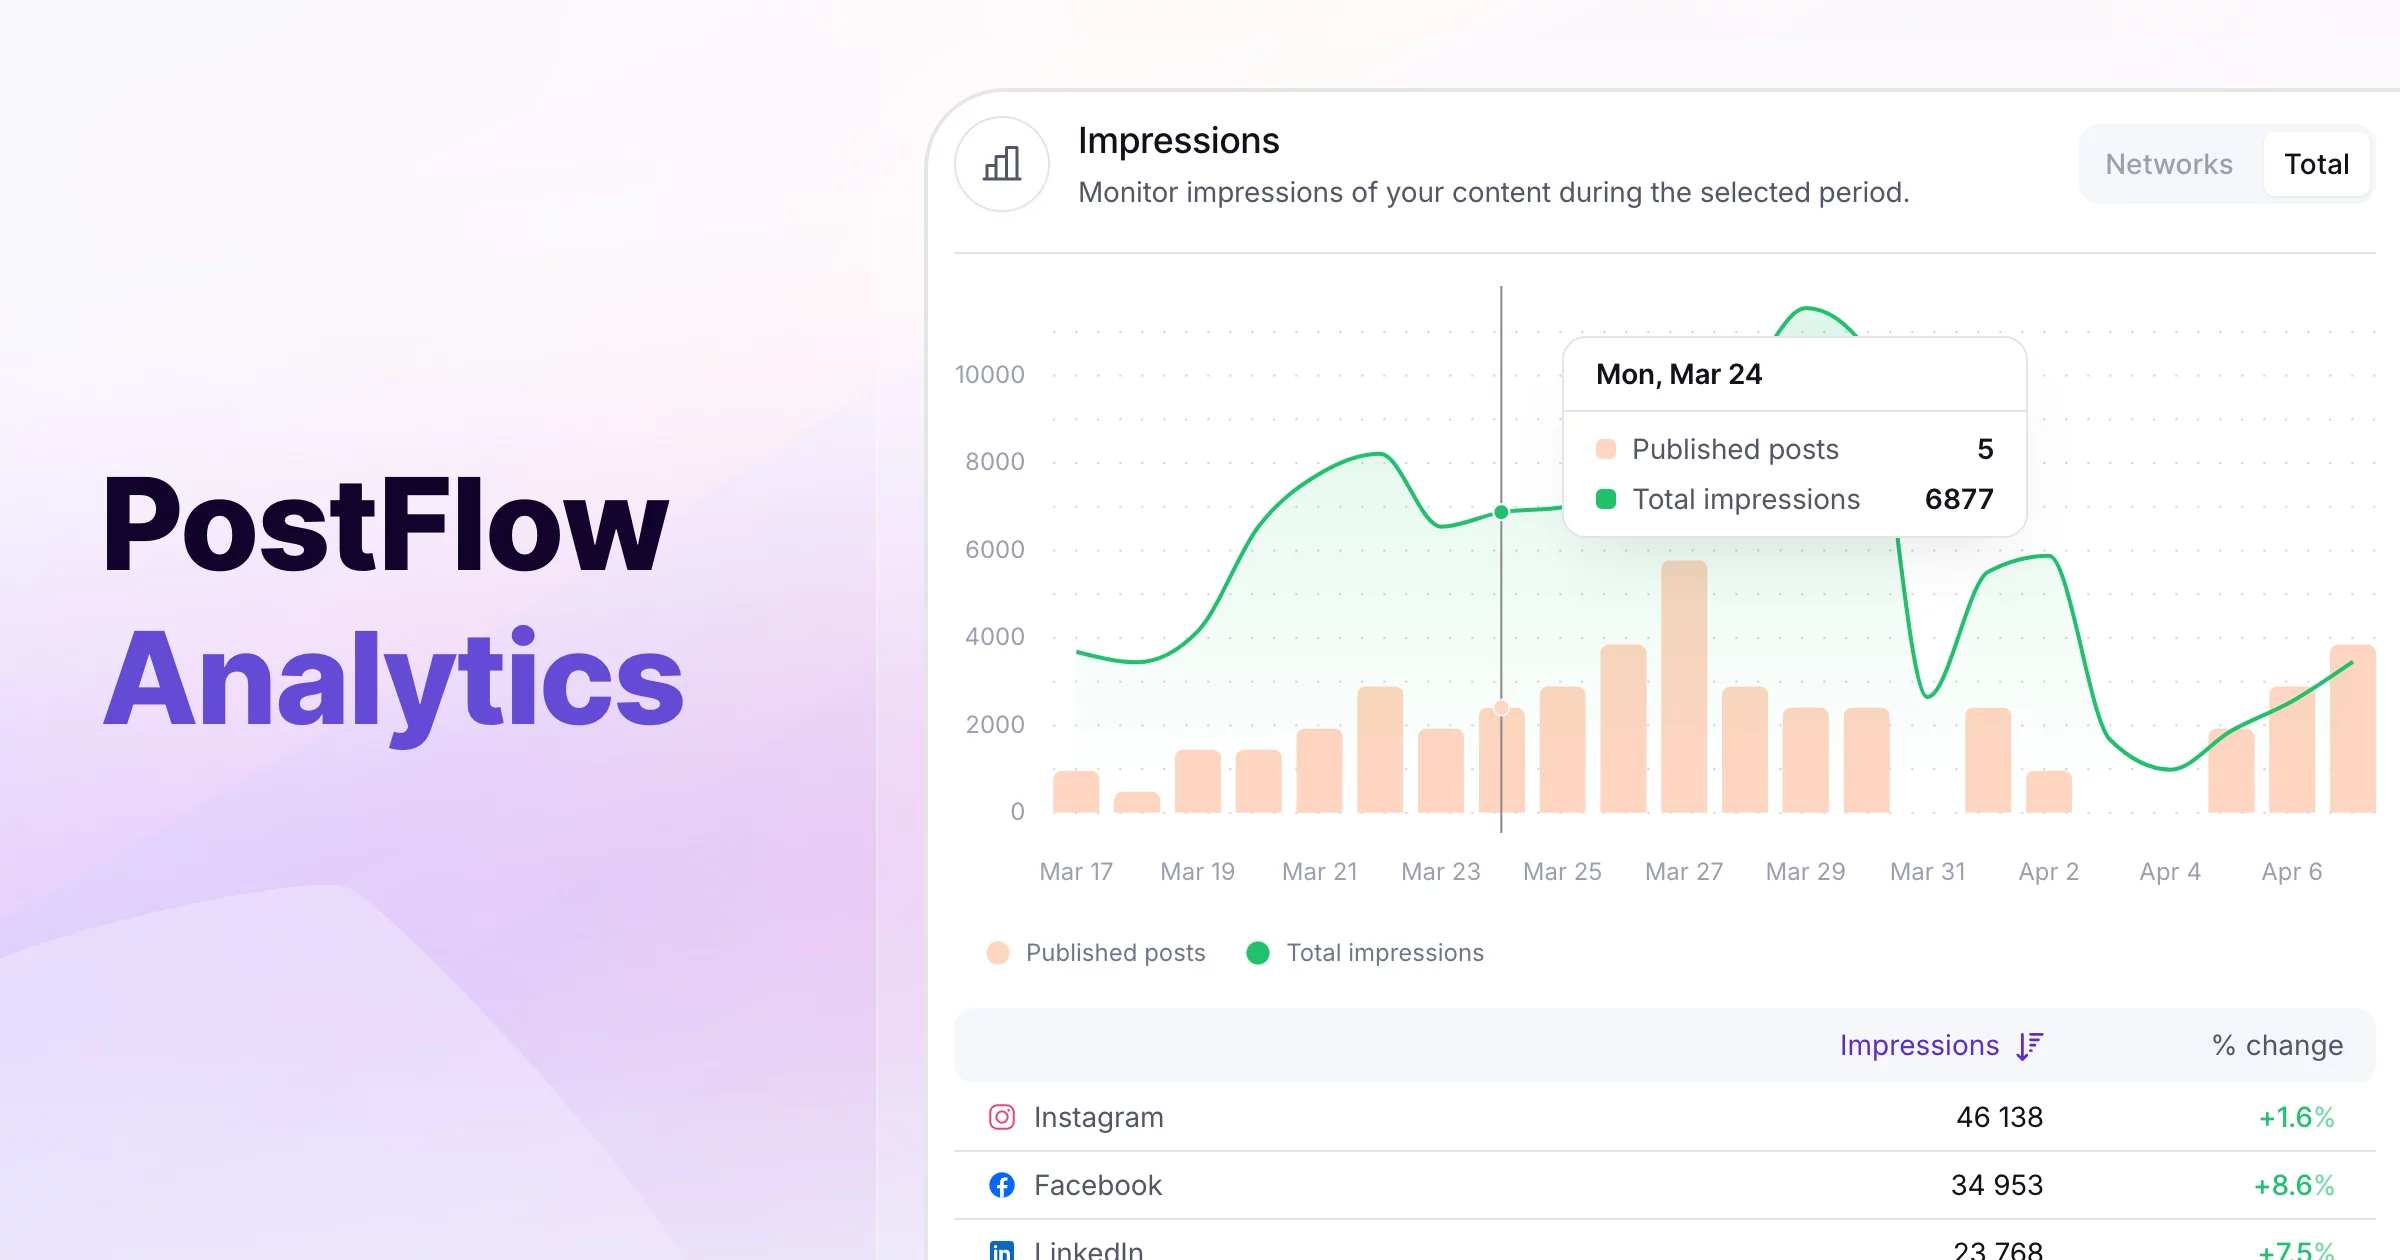
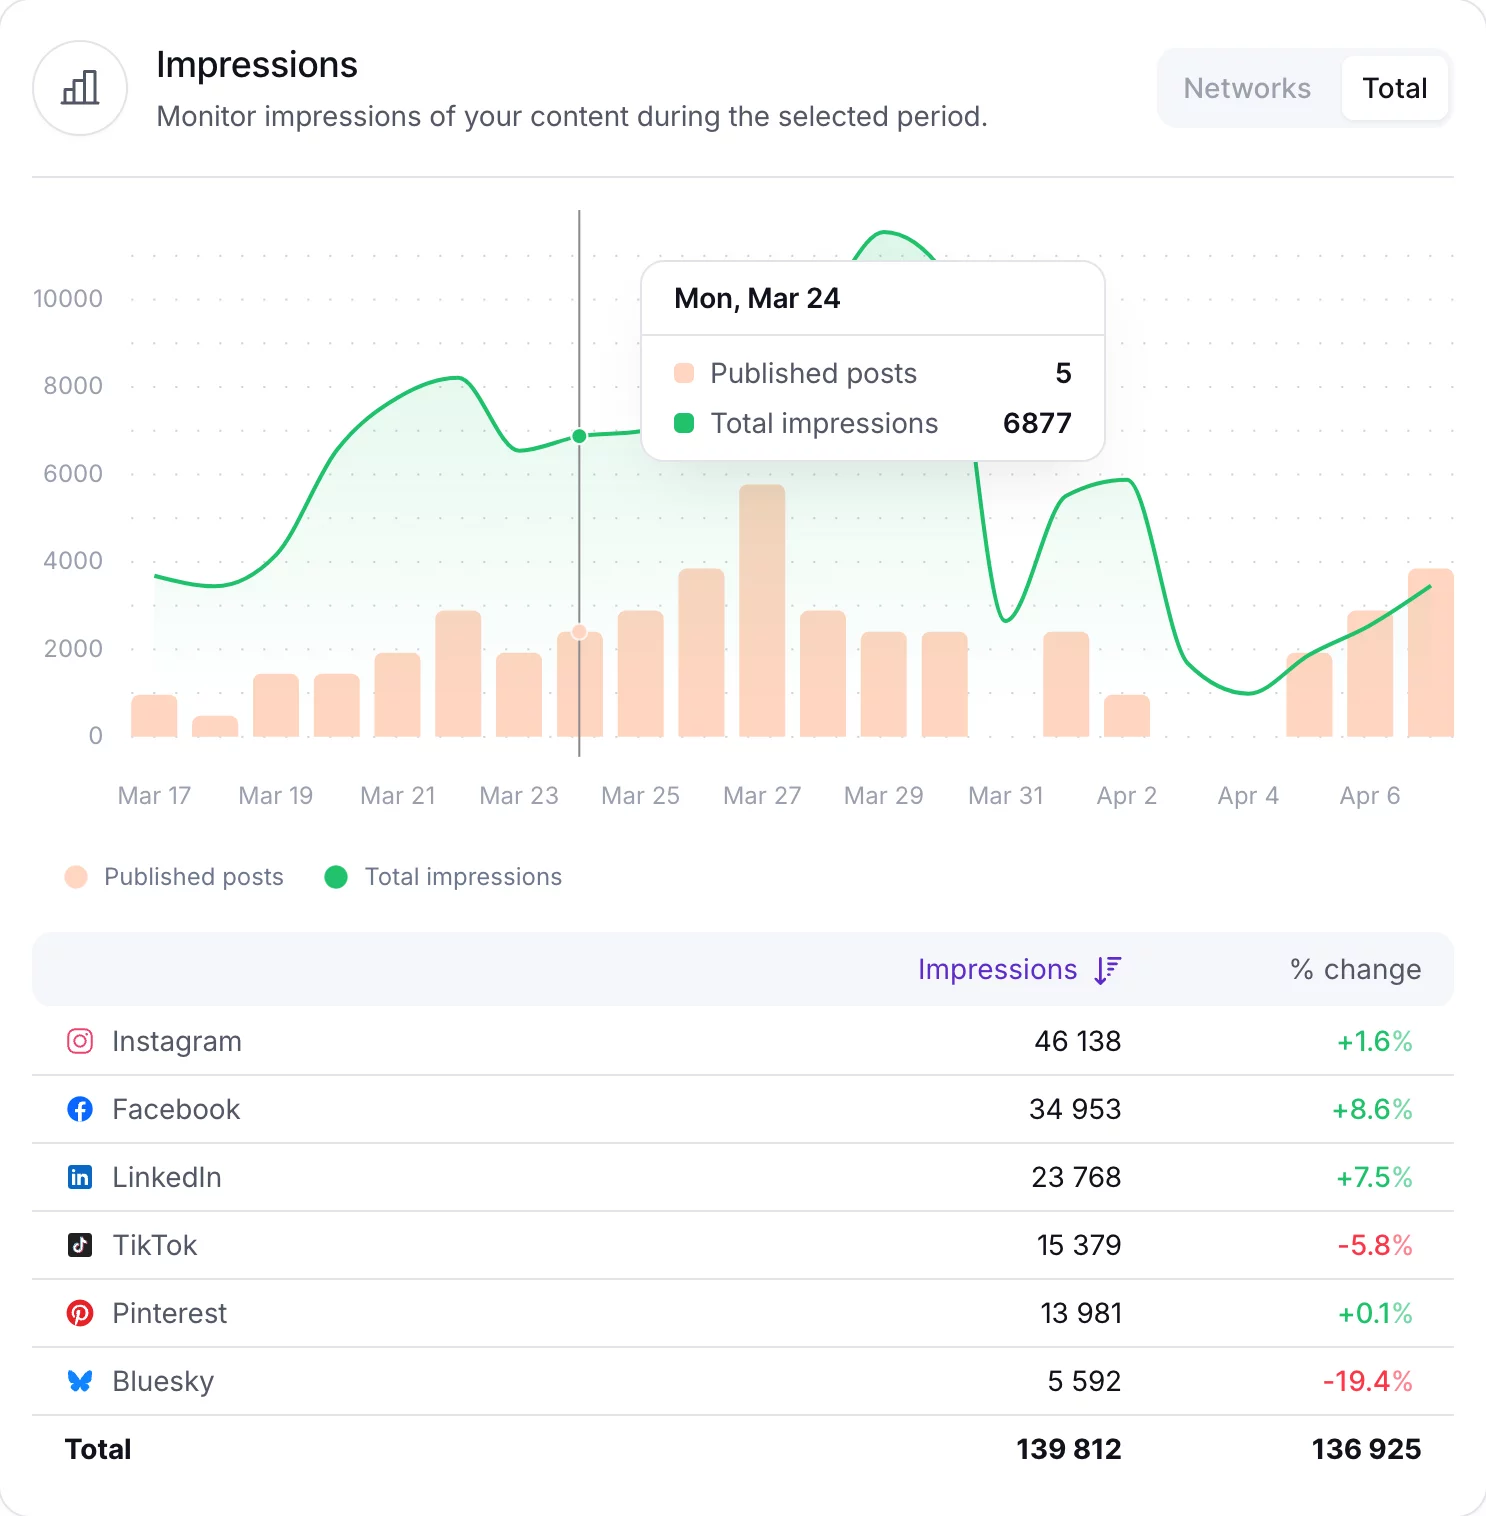
Track impressions
Monitor impressions by day for individual social networks or as a total for whole group, along with the number of posts published.
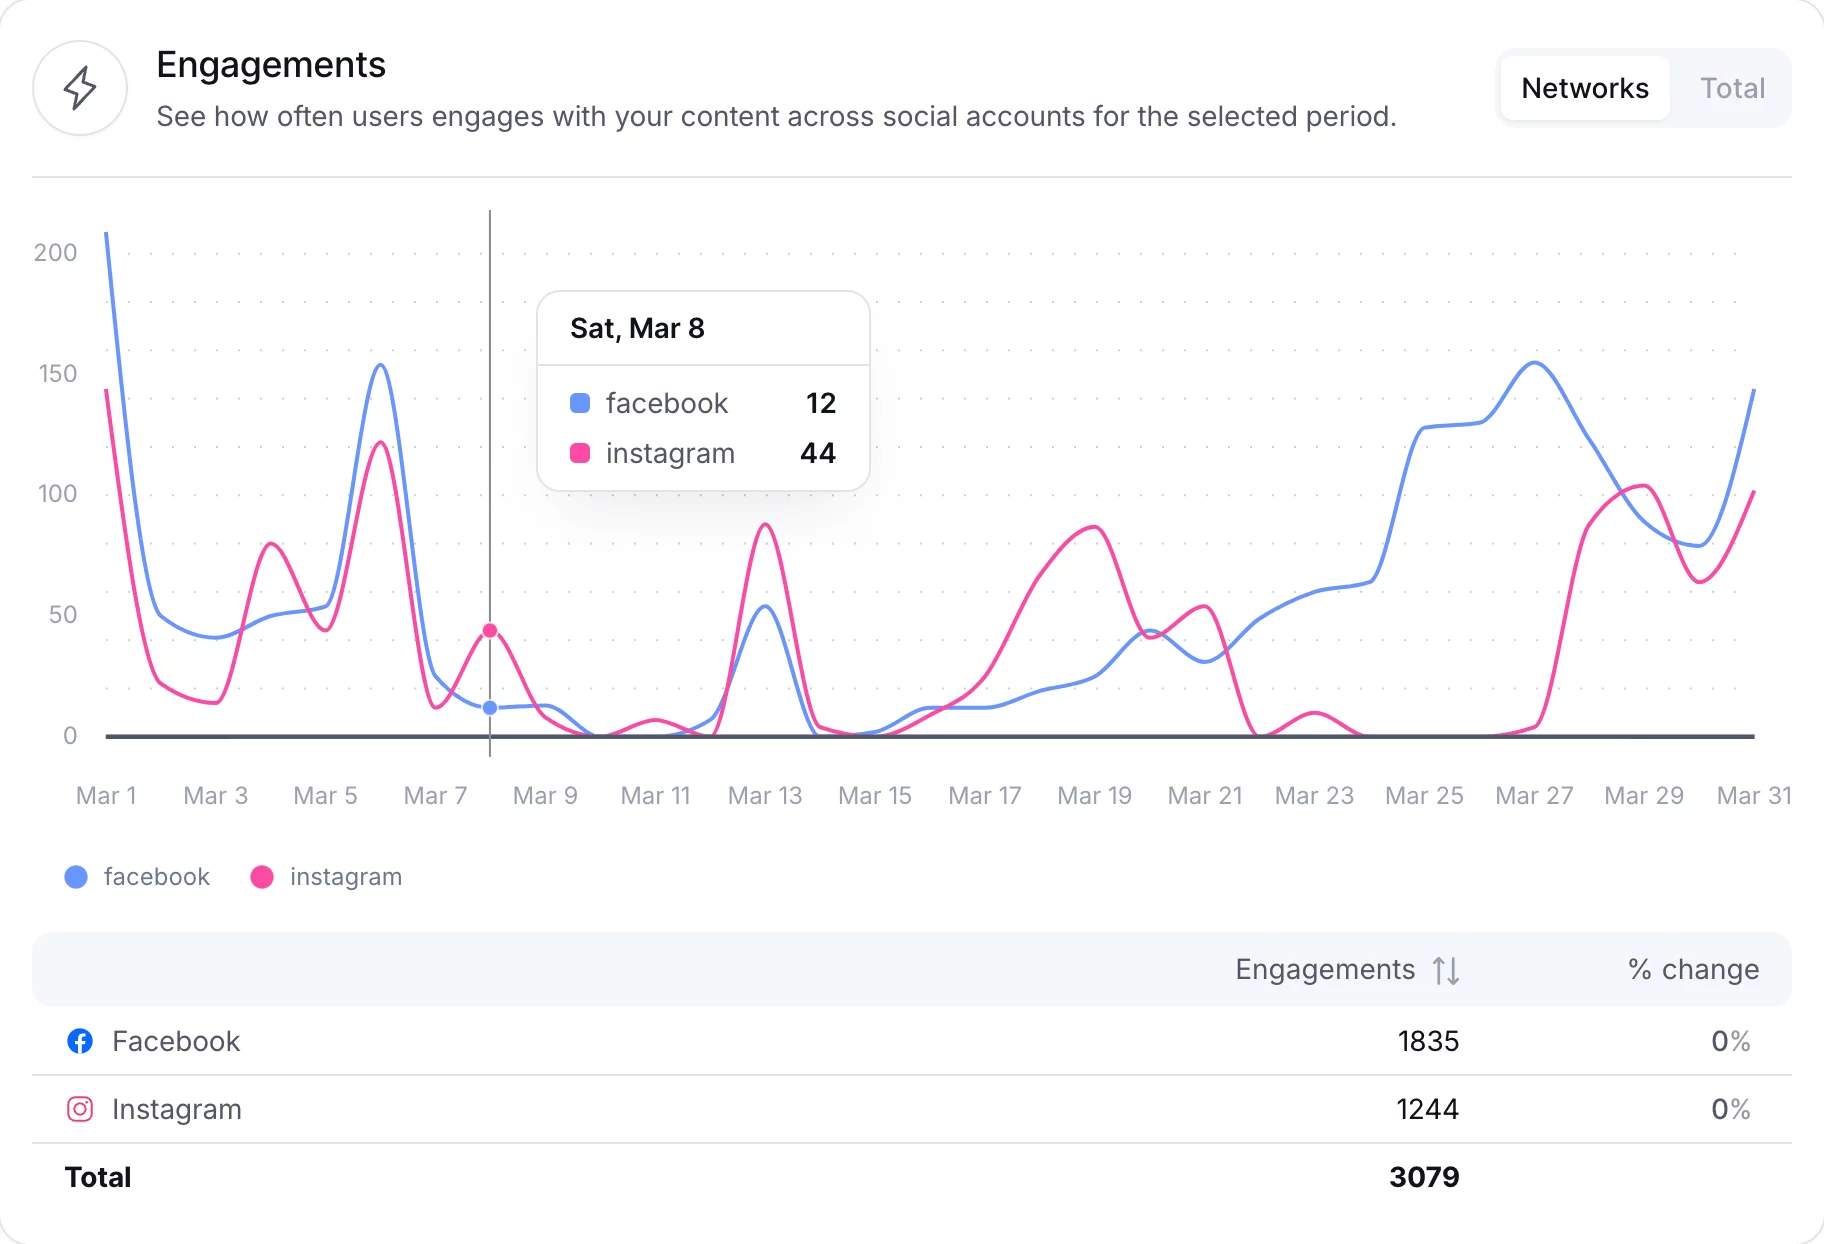
Engagements analytics
Understand how and where users interact with your content, track engagement by day and view total engagement over time, with related post volume.
Content Analytics
Content Analytics reveals the lifetime metrics and performance of posts published during the selected time range. With Content analytics, you can dig into the full picture of how your content performs at cross-platform level or on each social media network.
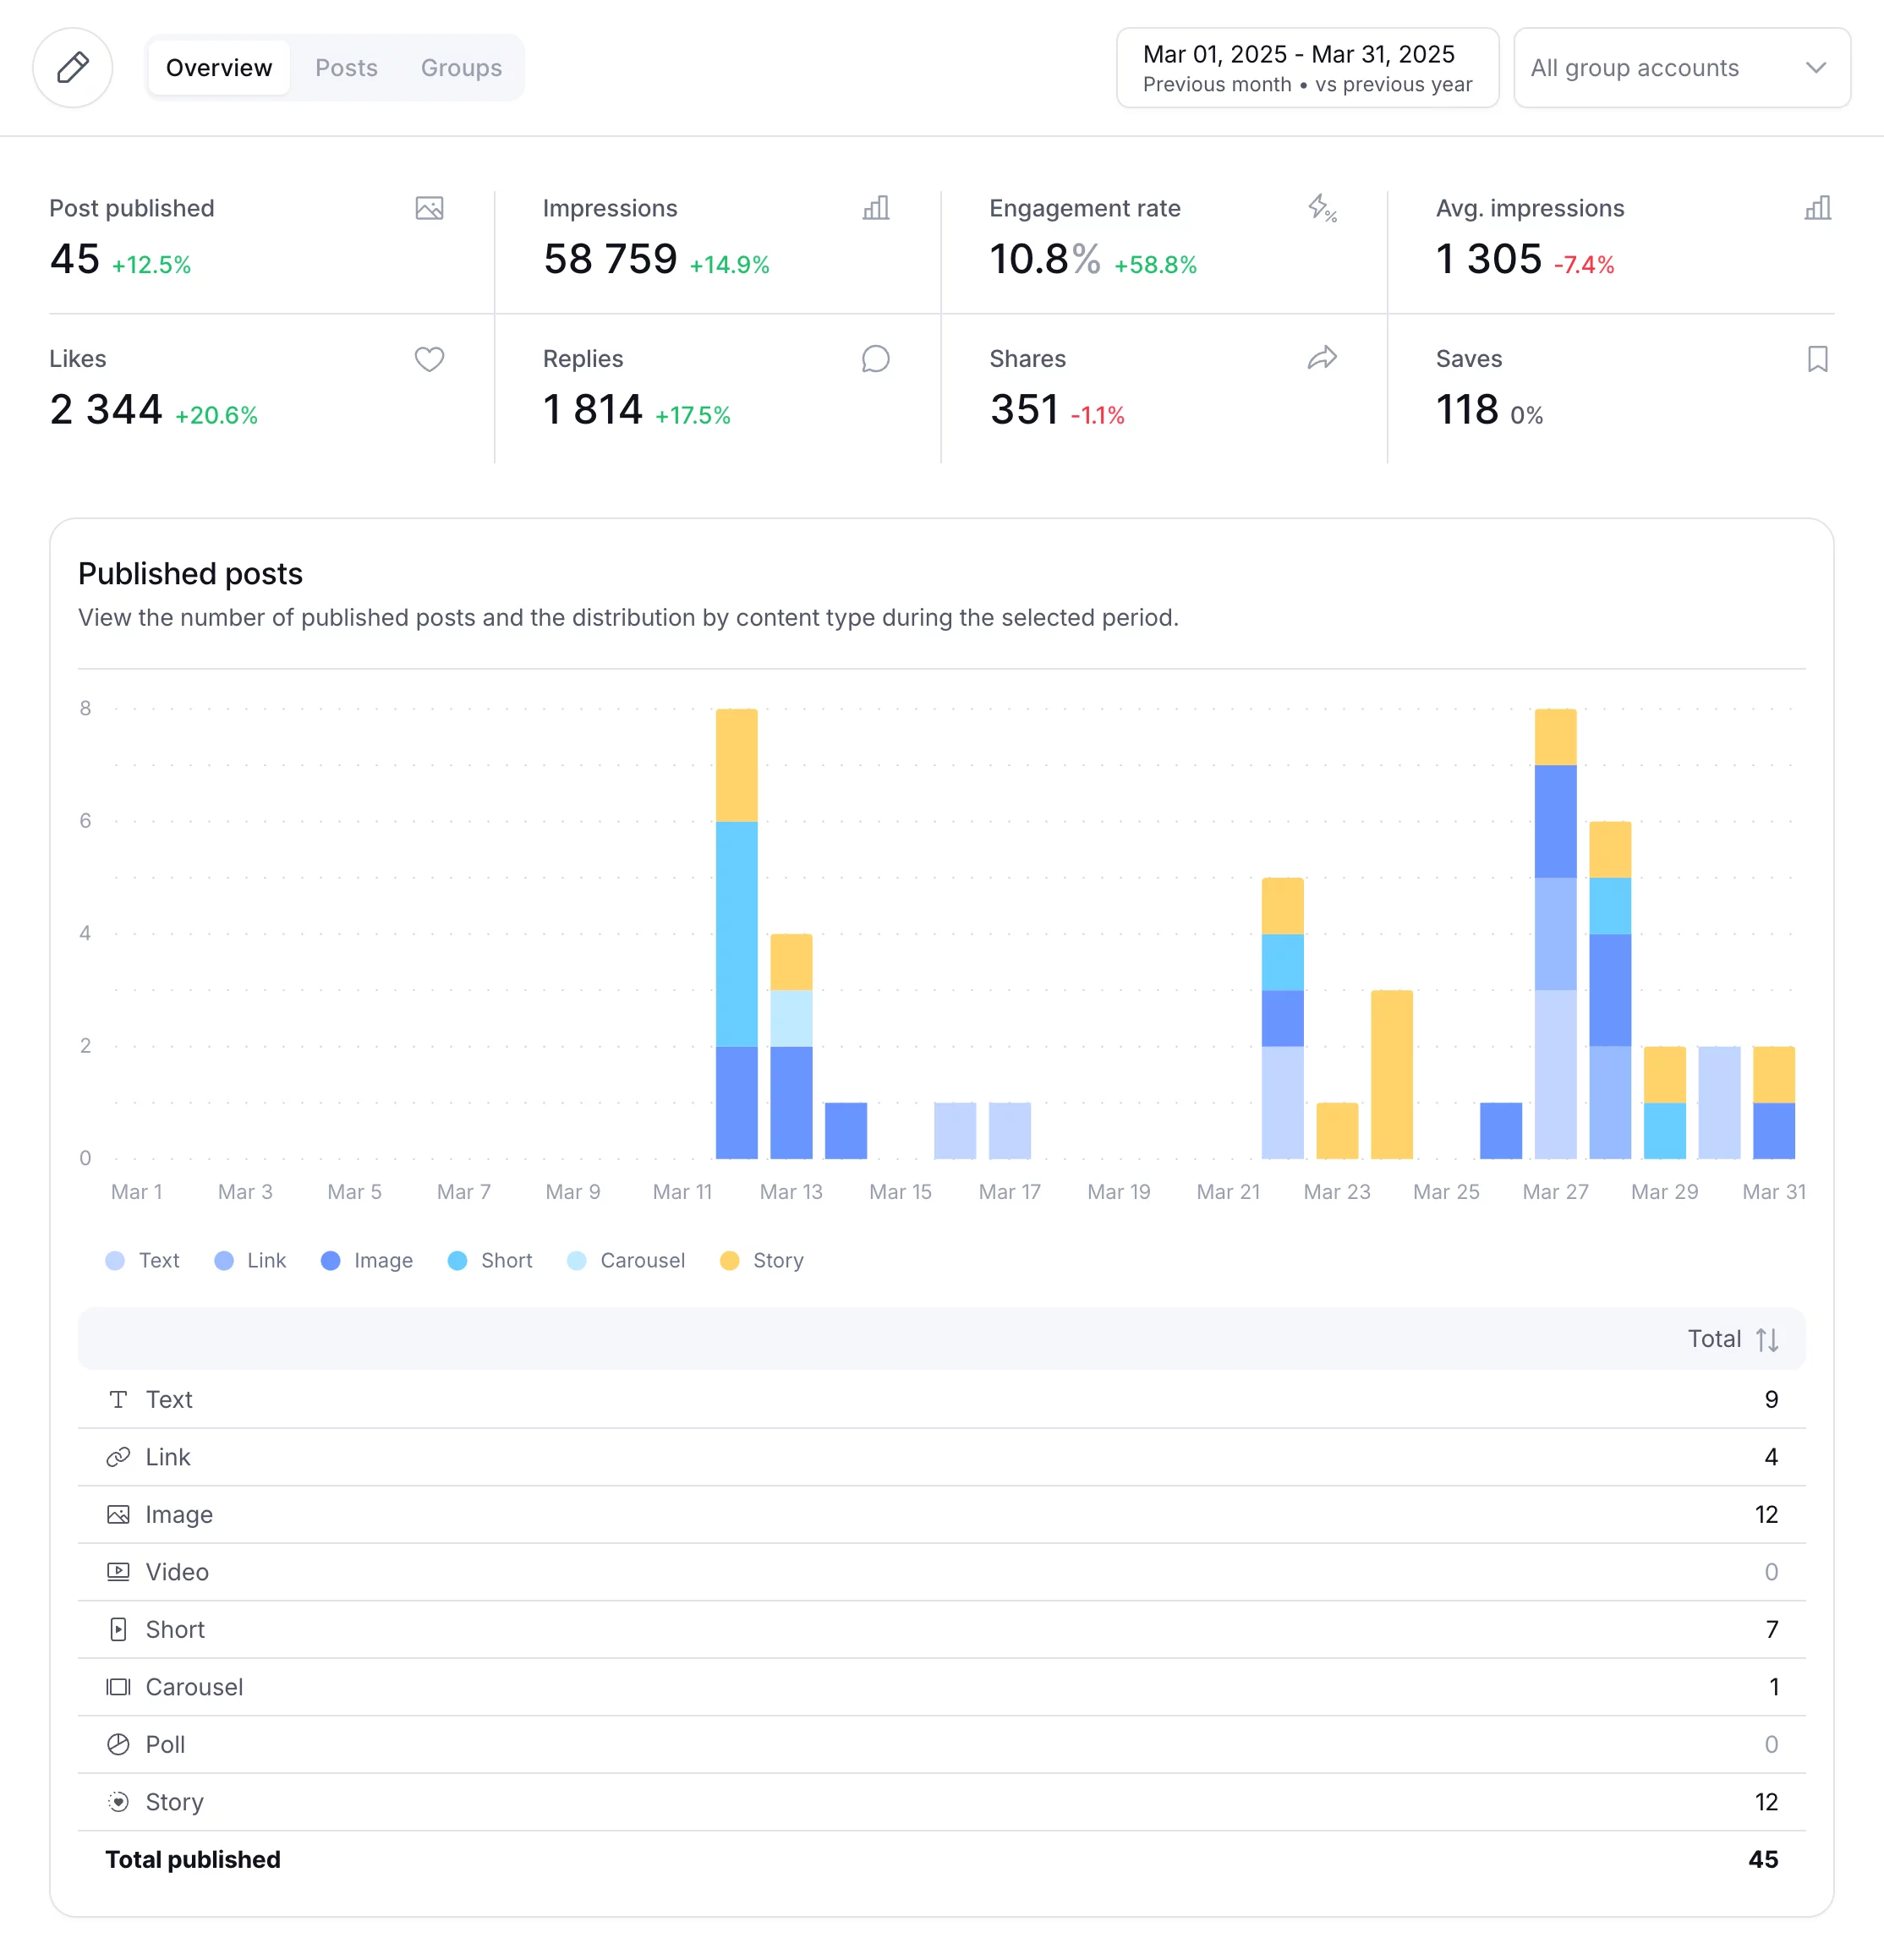
The overview section provides you with metrics including posts published, engagement rate, and other metrics such as impressions. You'll also find a visual representation of published content organized by day and content type (text, image, carousel, story, etc.). View the number of published posts and their distribution by content type during your selected period.
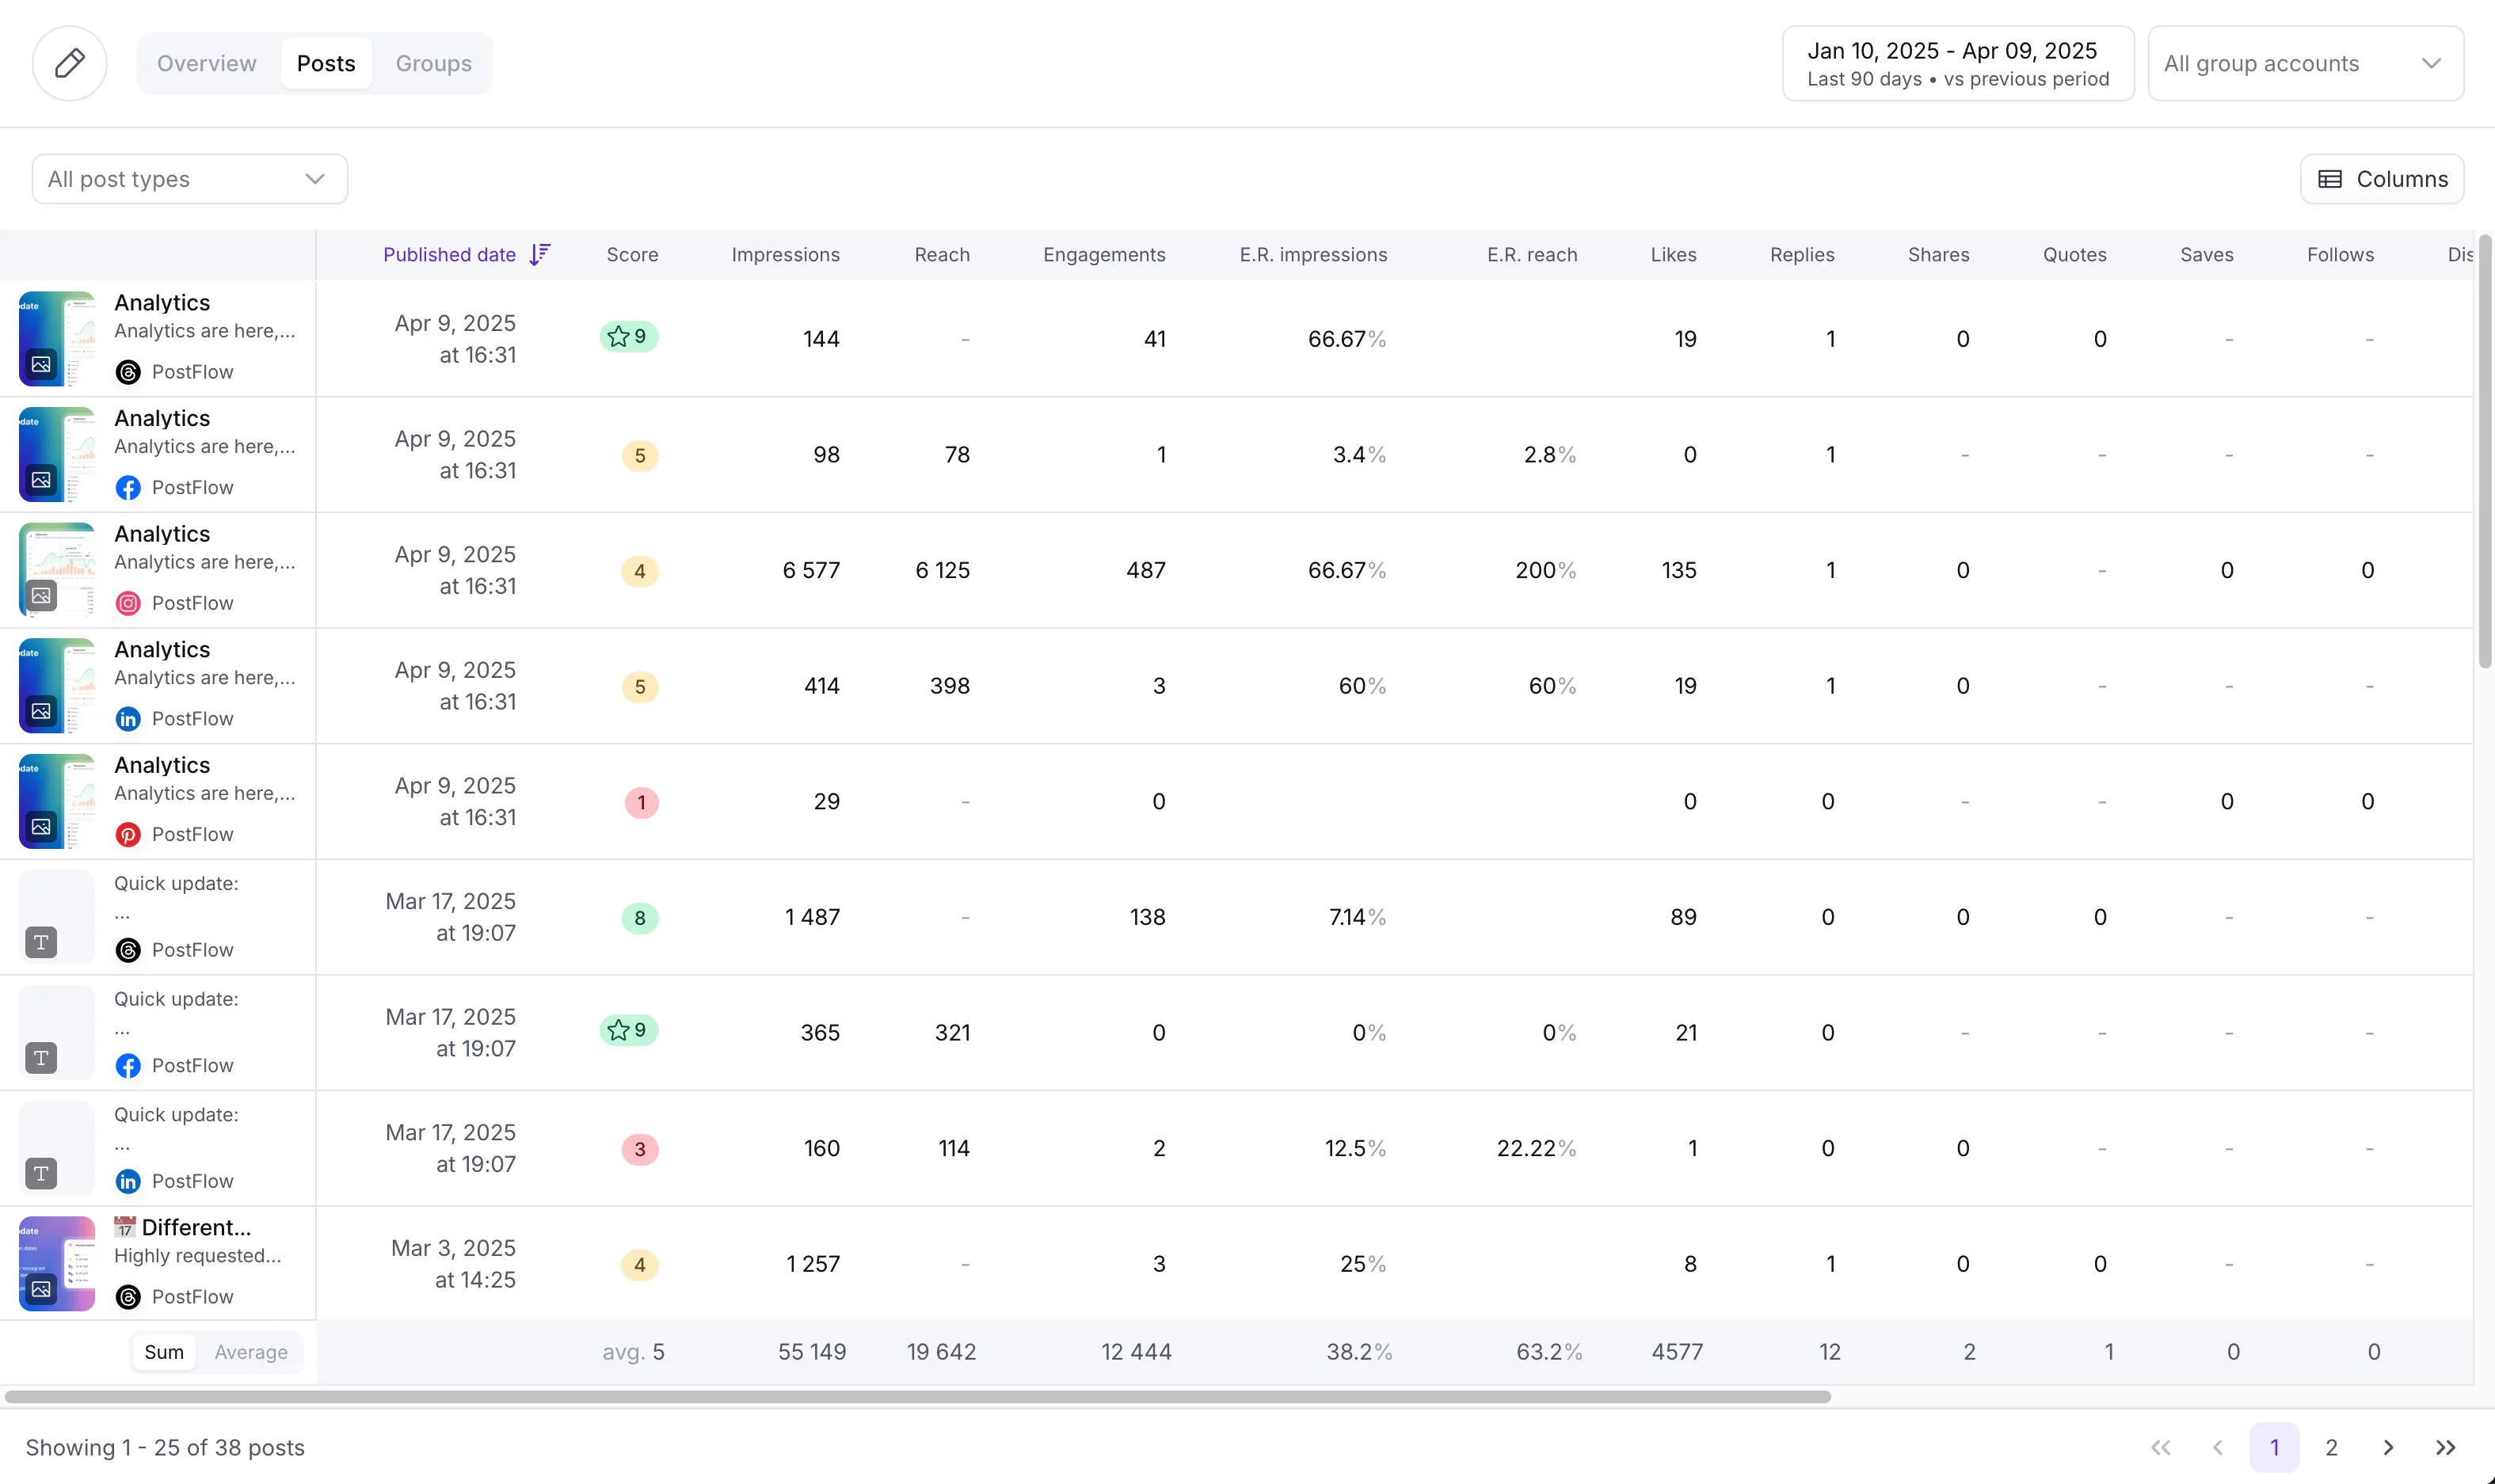
Post Analytics
In Post tab you will find detailed table view of all published posts with all performance metrics.
You can filter by content type and customize the table view to show only the metrics and columns you care about most. To customize table, just click the Columns button in the right.
Cross-platform analytics
The Groups tab provides a similar detailed table, but here, the data is aggregated for whole group of posts. This makes it easy to see the combined, cross-platform metrics for entire group, giving you a complete view of their overall performance.
Post score
PostFlow post score is your new quick performance indicator. You can evaluate how a post performs without diving deep into impressions and engagements numbers.
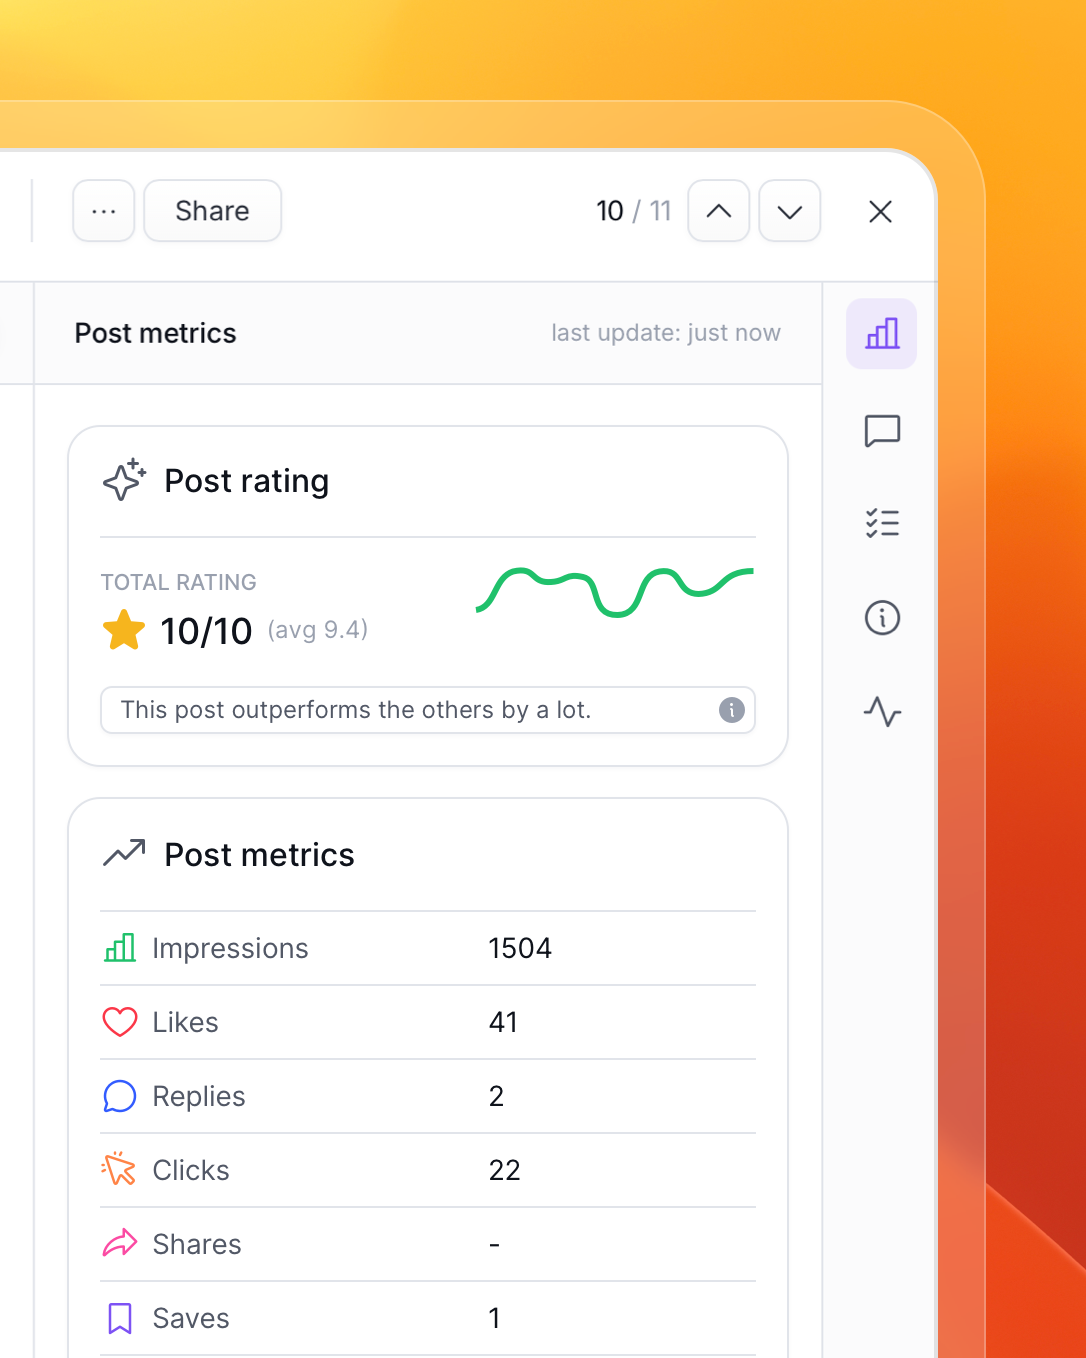
Each post receives a score from 0 to 10:
- 0 – no data yet
- 1–3 – below average performance
- 4–6 – average
- 7–8 – above average
- 9–10 – outperforms the others, at least 2x better than average post
The score is based on 60% engagements and 40% impressions.
Don't compare by score across social accounts. Scores are calculated per social account and per content type, so Instagram Stories and Instagram Reels will have separate benchmarks.
Content type groups:
- stories
- short-form video (e.g., Reels, YT Shorts, TikTok)
- all others
The post score is calculated across 10 predefined time intervals and reflects how a post performs over time.